Highlights
| Overview | Learn how to define a drill down path for a table component. |
| Key Features | Use drill down to summarize (group) data and use a presentation option to display or hide data in other columns. |
| Component | Drill down is only available for the table component. |
| Important | Only one column of data at any level can be grouped or summarized. |
Overview
In a table component, drill down lets you summarize, or group, data in a column and enable users to explore and analyze multiple levels of related data in other columns.
To use drill-down in a table component
These steps describe how to convert a table to use drill-down and assume your table has already been created.
Note
- All table columns must contain the same number of items and be aligned across rows.
- Only columns formatted as Text can be grouped. To group columns containing date/time data, the column must be formatted as Text (formula changes may be needed to accommodate this format).
- Only columns formatted as Number, Currency, Percentage or Duration can be summarized.
- Custom Results Rows do not automatically recalculate as the user drills down through the levels.
Step 1: Creating a drill down path
- Click Table in the component hierarchy, select the Drill Down tab and select Enable drill down.
- Group by: select the column to be summarized.
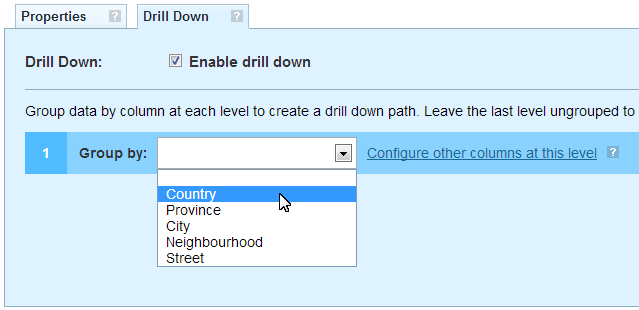
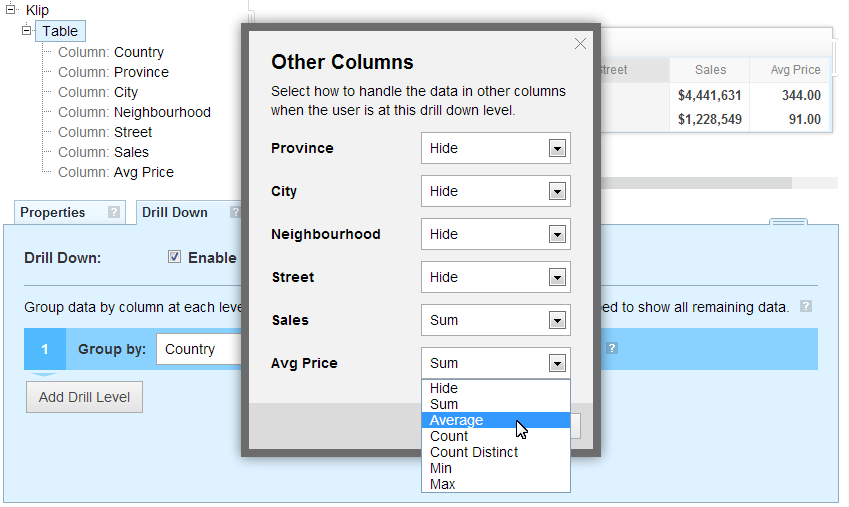
- To configure how remaining columns are displayed, click Configure other columns at this level.
- In the Other Columns window, choose one of Hide, Sum, Average, Count, Count Distinct, Min or Max to configure the display of the remaining columns. Sum, Average, Min and Max apply to columns containing numeric data only.
- Click Add Drill Level to group another column; repeat as required. To show/hide any remaining ungrouped columns, select blank from the Group by drop-down list, click Configure other columns at this level and choose Show or Hide
- Click Finished.
- Click Save to save the Klip.
Step 2: Drilling down on the data
View the Drilldown Table Klip on the dashboard and click a blue underlined link to view the next level of detail. For example, click a city (underlined) to display the next level of information.
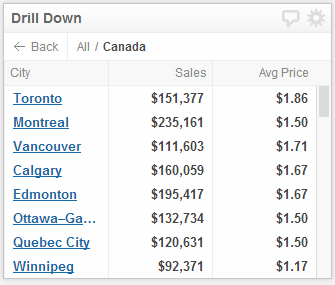
To return to a higher level of data, click Back, or to go to a specific column, click the column's header name. When you click a link and move from one level to another, the data in the other columns are immediately updated.